4a: Task abstraction
Why do data viz?
Why: An overview
Visualization Analysis and Design, chapter 3, Munzner
Why task abstraction?
Thinking about why in an abstract form, rather than the domain specific way users often talk about data viz.
This will allow us a framework to discuss use cases, which may on surface look different.
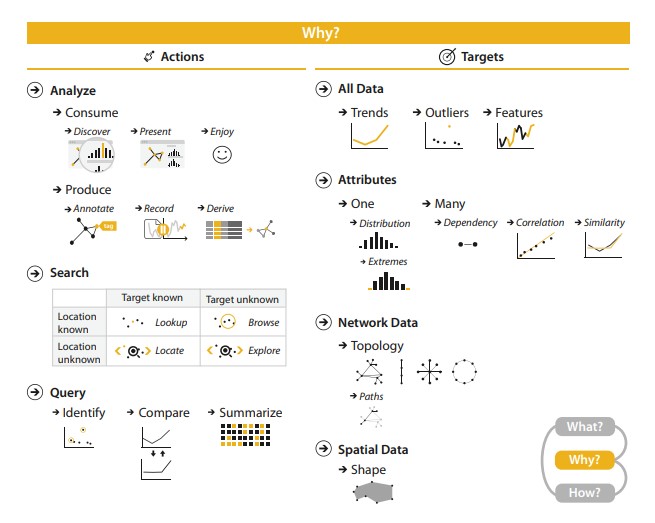
Actions / Targets
This proposed taxonomy is from Munzner's framework (Visualization Analysis and Design, chapter 3)
Actions in this case is a verb, and targets are nouns.
Reading: A multi-level typology of abstract visualization tasks, Bremmer, Munzner
Reading: Taxonomy of interactive dynamics for visual analysis, Schneiderman, Heer
Viz designer or user?
Are you consuming the visualization or producing it?
Viz tools fall somewhere along a continuum from specific to general.
On the general side, tools are flexible and allow users many choices what to make.
On the specific side, the tool is curated and choices are limited in how an end user can interact with the data set.
Exploratory vs Explainatory
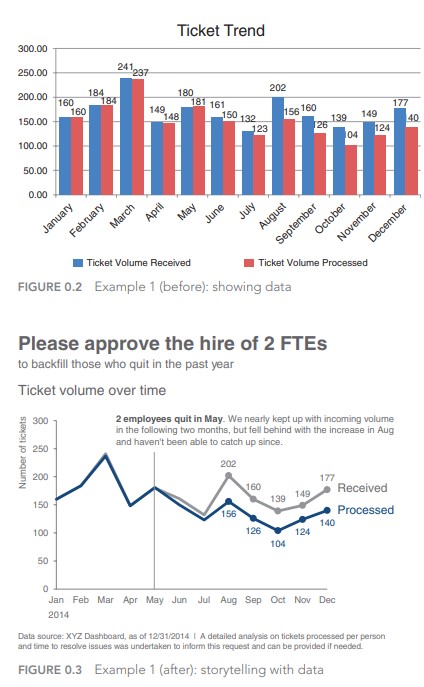
Storytelling with data, chapter 1, Nussbaumer
Why: 3-levels of actions

Visualization Analysis and Design, chapter 3, Munzner
For more specifics read up her white paper linked here.
Why: 3-levels of actions
A framework for why a task is performed, and includes multiple levels of specificity, a narrowing of scope from high-level (consume vs. produce) to midlevel (search) to low-level (query).
Analyze: Consume data
Exploratory Analysis
Presentation
Enjoyment
Produce data
Annotate, e.g. adding text labels to existing charts
Record, e.g. screenshots, video recordings of visualizations
Derive, e.g. create new datasets based on existing ones.
Search
| Target known | Target unknown | |
| Location known | Lookup |
Browse |
| Location Unknown | Locate |
Explore |
Query
Identify
Compare
Summarize
Targets
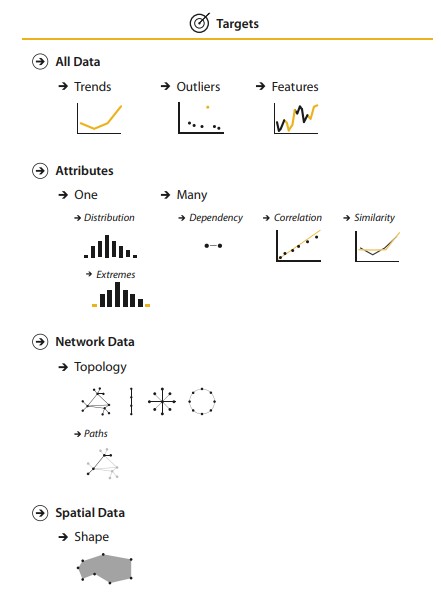
Visualization Analysis and Design, chapter 3, Munzner
All together: task breakdown
Example: Which carpark is the one with the highest utilization in SG on Monday mornings?
- Analyze: Exploratory analysis
- Search: Locate
- Query: Identify
- Target: One attribute, utilization
All together: task breakdown 2
Example: SG election. What interesting trends can we see overall?
- Analyze: Presentation
- Search: Explore
- Query: Compare, Summarization
- Target: Trend, Outliers
Industry perspective on why data viz
| Sample job | Why data viz | Tools |
Data scientist |
Getting insights | Python, R. Quick and dirty charts |
Business analyst |
Insights + simple dashboards for client / management | Tableau, PowerBI, Qlik |
Data journalist |
Storytelling. Presentation to make things clear | Graphics / animation tools and libraries |
Code artist |
Presentation to impress | 3D / Animation / sound / interaction libraries |
Product frontend |
Building a custom product for a specific usecase | D3, JS and CSS frameworks |
Product backend (e.g. regulator) |
Building a custom product for a specific usecase | tech architecture, database and warehousing, backend and devops |
How: An overview

We'll cover definitions and sample idioms later in the course.
Questions?
Chi-Loong | V/R