3a: Task abstraction
Why do data viz?
Why: An overview
Visualization Analysis and Design, chapter 3, Munzner
Why task abstraction?
Thinking about why in an abstract form, rather than the domain specific way users often talk about data viz.
This will allow us a framework to discuss use cases, which may on surface look different.
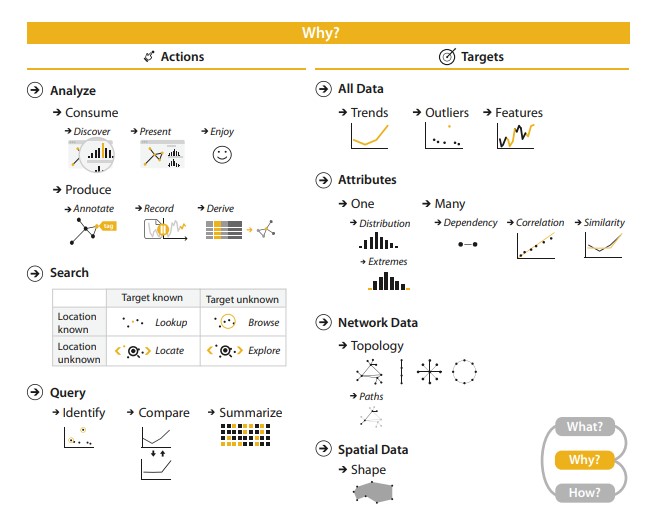
Actions / Targets
This proposed taxonomy is from Munzner's framework (Visualization Analysis and Design, chapter 3)
Actions in this case is a verb, and targets are nouns.
Reading: A multi-level typology of abstract visualization tasks, Bremmer, Munzner
Reading: Taxonomy of interactive dynamics for visual analysis, Schneiderman, Heer
Viz designer or user?
Are you consuming the visualization or producing it?
Viz tools fall somewhere along a continuum from specific to general.
On the general side, tools are flexible and allow users many choices what to make.
On the specific side, the tool is curated and choices are limited in how an end user can interact with the data set.
Exploratory Analysis vs Presentation
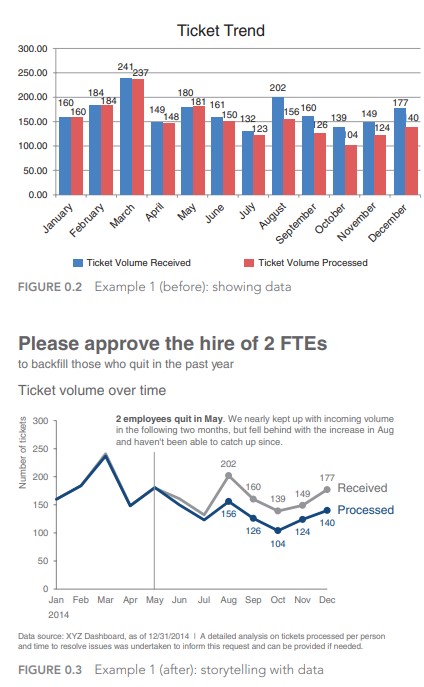
Storytelling with data, chapter 1, Nussbaumer
3-levels of actions
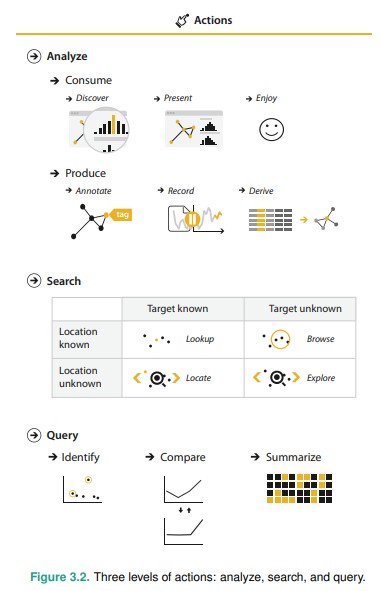
Visualization Analysis and Design, chapter 3, Munzner
Actions (verbs)
The framework give us a way to think about how and why we do tasks, from the high level (how we analyze) to mid-level (how we search) to the low level (query structure).
Analyze (high level)
Most visualizations are used to consume information in many domain contexts.
Typically it is either for exploratory analysis or for presentation.
When we talk about producing we're talking about generating new data / artefacts - e.g. through annotations and derived columns.
For example, annotating outliers, or tagging clusters in open ended text queries.
Search (mid level)
| Target known | Target unknown | |
| Location known | Lookup | Browse |
| Location unknown | Locate | Explore |
Location: Where does this data exist in?
Target: What do you want to query?
Let's use the carpark example.
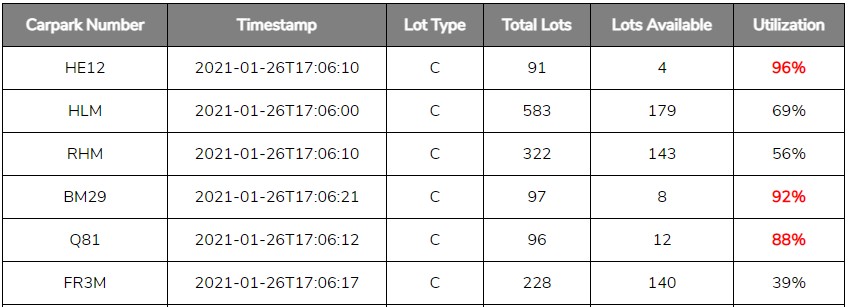
- What's the utilization of carpark BM29 now?
- Which carparks have lot type 'C'? List them.
- Which housing estate is carpark BM29 in?
- Which housing estate has the highest carpark utilization?
Search Query
If a search queries known targets (lookup or locate), identify returns their characteristics (the column).
If a search queries references based on characteristics (browse or explore), identify returns references (rows).
Query Structure (low level)
Identify — Compare — Summarize is a scale of progression of what to do with the data returned via the query.
E.g. Which carparks have utilization more than 90%?
- Identify: Just list the data
- Compare: Perhaps sort by utilization so we can more easily compare
- Summarize: Group carparks by some other metric, e.g. time, area.
Targets (nouns)
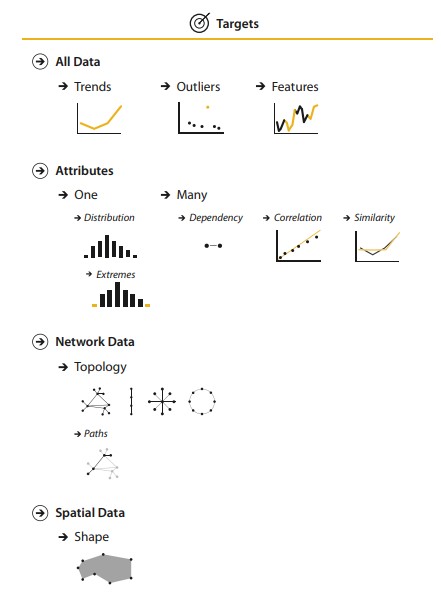
Visualization Analysis and Design, chapter 3, Munzner
What is the target we're returning?
- Data: are we looking for trends? Outliers? Specific features?
- Attributes: are we looking for one attribute or many? Comparison, distribution, correlation?
- Network Data: are we looking at the topology of the network?
- Spatial Data: are we looking at the shape of a feature? Distribution or clustering of points?
All together: task breakdown
Example: Which carpark is the one with the highest utilization in SG on Monday mornings?
- Analyze: Exploratory analysis
- Search: Browse
- Query: Identify
- Target: One attribute, utilization
All together: task breakdown 2
Example: SG election. How did the opposition fare in 2020 compared to 2015?
- Analyze: Presentation
- Search: Explore
- Query: Compare, Summarization
- Target: Trend, Outliers
Thought exercise
How would you frame all these queries?
- How do I get from SUTD to Sembawang?
- Which countries in the world have the highest taxes?
- What is the current PSI like in Singapore? In the region?
- Is Changi a sustainable district?
Think about how you would frame your final capstone project query.
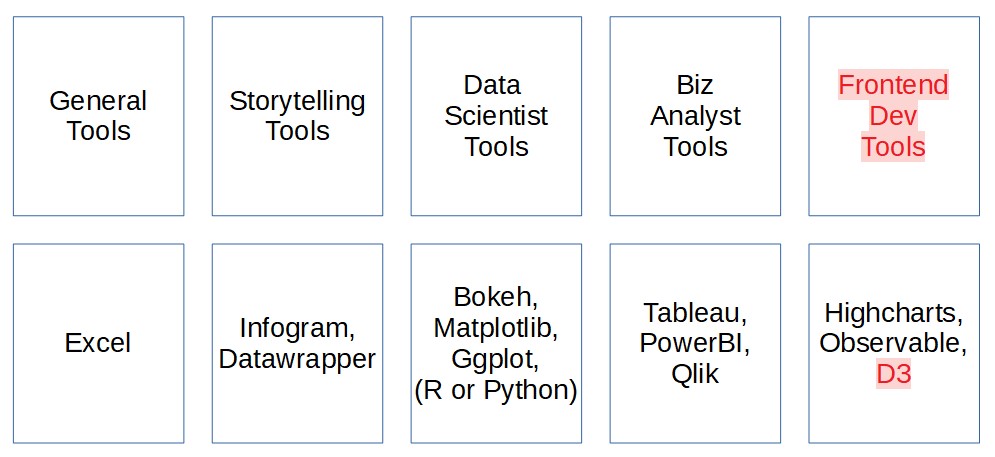
Industry perspective on why data viz
| Sample job | Why data viz | Tools |
Data scientist |
Getting insights | Python, R. Quick and dirty charts |
Business analyst |
Insights + simple dashboards for client / management | Tableau, PowerBI, Qlik |
Data journalist |
Storytelling. Presentation to make things clear | Graphics / animation tools and libraries |
Code artist |
Presentation to impress | 3D / Animation / sound / interaction libraries |
Product frontend |
Building a custom product for a specific usecase | D3, JS and CSS frameworks |
Product backend (e.g. regulator) |
Building a custom product for a specific usecase | tech architecture, database and warehousing, backend and devops |
Viz Tools recapped
How: An overview
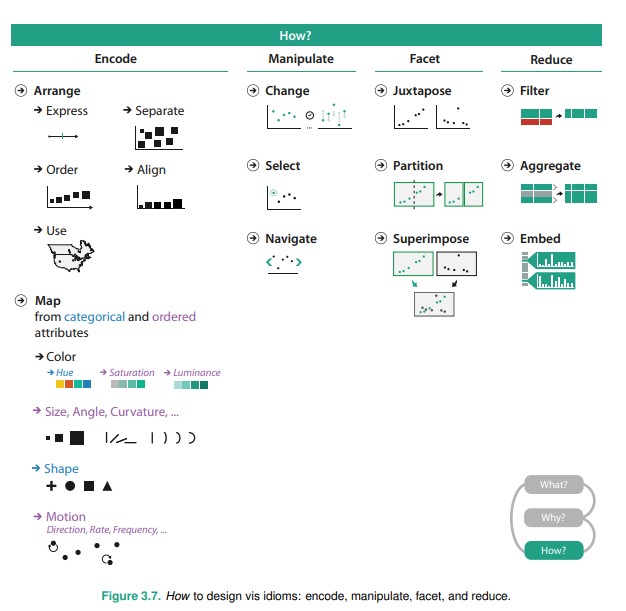
We'll cover definitions and sample idioms later in the course.
Questions?
Chi-Loong | V/R