Data manipulation
Bootcamp day 2
Pivot Tables
Pivot Tables are an easy way to analyze data using a spreadsheet.
They exist in Microsoft Excel (cloud and desktop), Google sheets and opensource office tools (like Libre Office).
Boot up Excel
For this bootcamp we'll be using Microsoft Excel. I'm using the free office365 version, and it should be similar to your SUTD version.
Please download a sample version of this sample sales data CSV file (source: Kaggle link) and open it up in Excel.
Analysis
- See sales numbers of each product line and product code
- Cross reference with year
- Add basic visualization so that it is easier to see
- Add deal size filter
Exercise
- Which country had the most number of deals? For what product lines? What was the total sales amount?
- What is the average deal size of a small motorcycle deal in 2003 in USA?
- What product lines did each customer in the UK buy across 2003 to 2005 and what is the total sales amount?
Synthesis
Now let's put everything together.
Which university in Singapore has the highest graduate employment rate in 2021?
What course and what's the mean monthly salary?
Other perspectives
Higher order analytic tools like PowerBI and Tableau. Really useful for connectors to various data platforms.
SQL is useful to know if you're doing deeper dives into data.
ETL tools (Extract, transform and load) tools. Mainly if you have loads of data and it is a warehousing and architecture problem.
Data merge
Using some programming
Table merge
If you're merging tables on a column Excel can do it using power query or table wizard.
Tools like PowerBI or Tableau can probably do this as well.
JSON merge
For JSON you can combine your datasets in a GIS (Geographic Information System) tool like ESRI ArcGIS or the opensource QGIS. Or use cloud-based tools like Carto or Mapbox.
If you take my module on visualization we'll go through these perspectives in more detail when we talk about geospatial viz.
Libraries
for data manipulation
There are tons of libraries out there. Here is just a small sample of popular libraries for some languages.
- R: dplyr. Very SQL-like
- Python: pandas, numpy
- javascript: underscore, D3
Exercise
We're going to do some very simple programming using JS.
We're going to merge a JSON (GeoJSON format) and a CSV file on a common field.
Why: Task
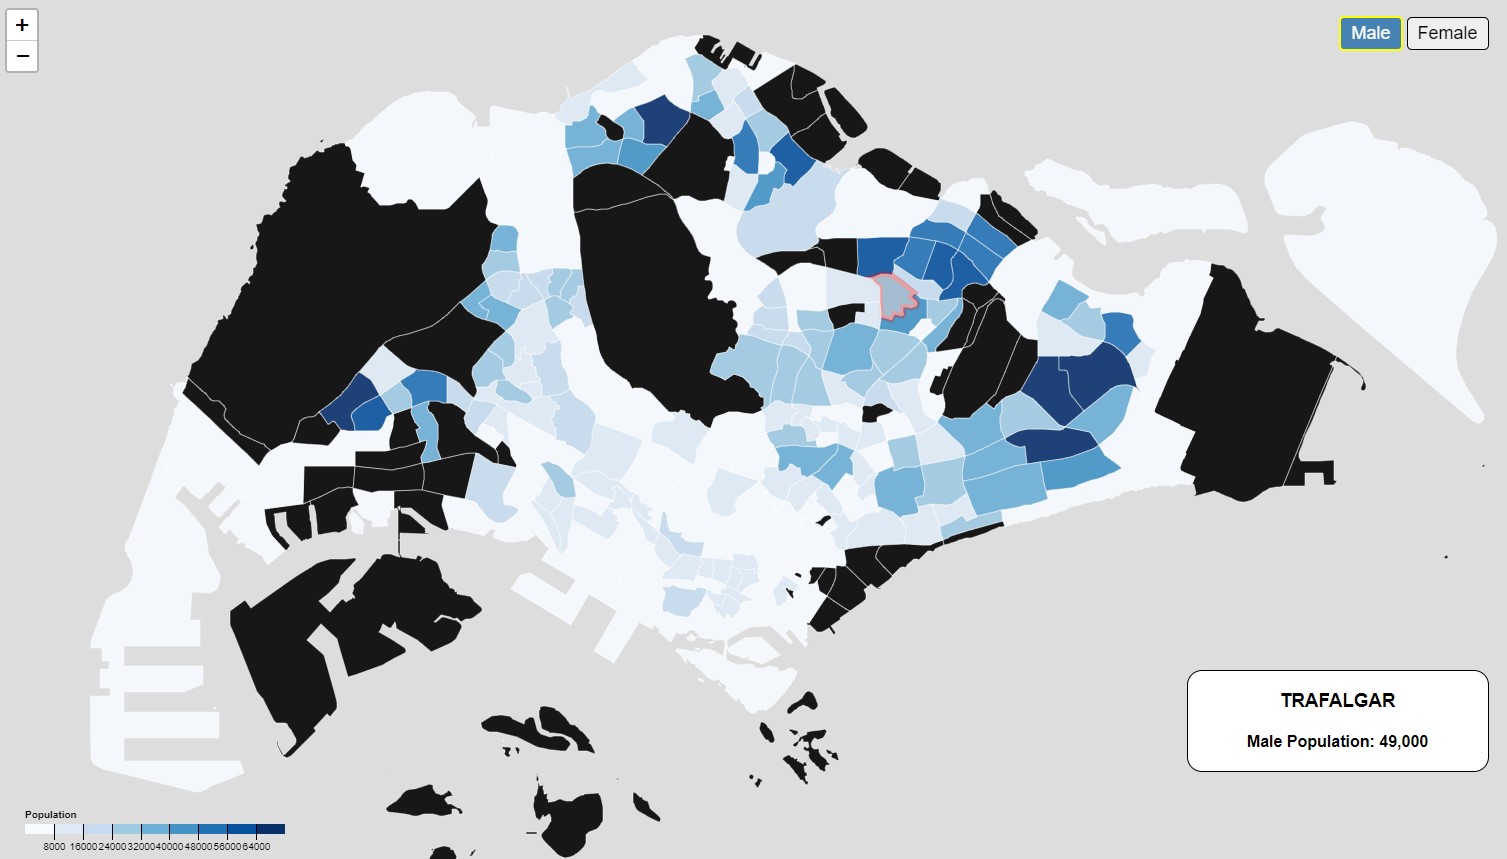
We're preparing data for a chloropleth visualization from 2 data sources
Exercise
Download the sample HTML file, the JSON and CSV in the same directory.
Fire up an editor and take a look.
CORS
Oh no! A whole bunch of CORS (cross origin resource sharing) errors when trying to run the html file.
This is for security reasons, making sure that javascript doesn't inject some malicious code into your system when you load data.
Local web server
The best way to get around this is to run a web server, which locks down the protocol to just web traffic.
(You can also disable security under developer mode but this is not recommended)
VSCode or http-server
Two easy ways to get a local live server (amongst many, many others!)
Fire up VSC and download the live server extension and run it.
Alternatively, if you have NPM (node package manager) installed - just run npx http-server in the local directory.
Code: JS
Let's use the console.log to examine the data structure of the two files.
And then let's go through the merge step-by-step.
Code: Python
I'm not going through this but in Python you can use Pandas dataframe to merge the 2 files.
Final code
A version of the merged data file is here.
You'll see this again in assinment 4 if you're taking my module.
Questions?
Chi-Loong | V/R