Assignment 3
Singapore population choropleth
Setup
To be completed before 30-6-2022(Thurs) 2359hrs
- This repo link will be of the format https://<username>.github.io/CSC3007-assignment3
- In the repo create a basic index.html file, and make it visible on GitHub repo pages (it's under the settings tab, under GitHub pages).
- You can put your CSS style tags, HTML and JS script code into one file, or organize them into files/directories.
Why: Task
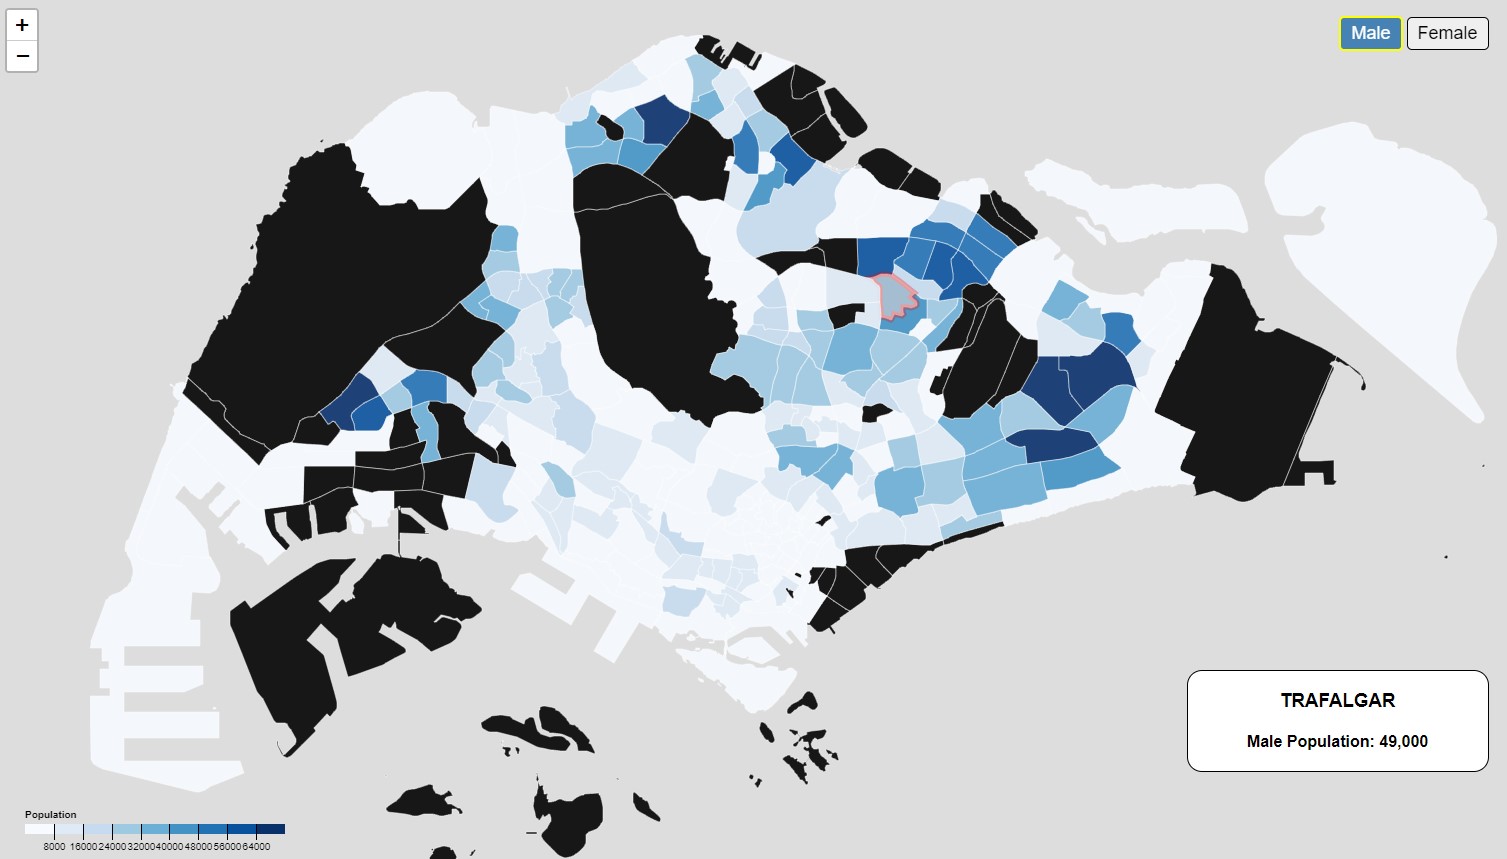
A choropleth visualization shows off which subsdistricts have the most population in SG.
What: Dataset
- We'll be looking at the Singstat Population Geospatial Timeseries.
- We'll also be looking at the Data.gov Master Plan 2019 Subzone Boundary.
- There is going to be some data manipulation and preperation. I'll walk through this in class.
How: Encoding
The main visualization encoding has been chosen - a choropleth map.
However, add in a legend, a title. Also add any interaction tooltips as you prefer.
I have gone through in class building a choropleth in D3, but you can build this in whatever platform you choose as long as the result is visible in your assignment repository.
For example, purely in Leaflet, ArcGIS, Mapbox, etc.
Template starter
I've given links to both the datasets used so you can feel free to take the data from there.
However, I've also cleaned the dataset on both the GeoJSON data and also the 2021 population data.
I've also included a simple template D3 starter.
Requirements / Extra challenges
A legend for the choropleth map is required.
Interactivity for tooltips when hovering over the subdistricts - print out the population data.
Theme the map to look decent / nice.
Grading key
- Some submission: 2 marks
- Basic choropleth: 3 marks
- Add in legend / basic interactivity: 4 marks
Questions?
Chi-Loong | V/R