Assignment 1
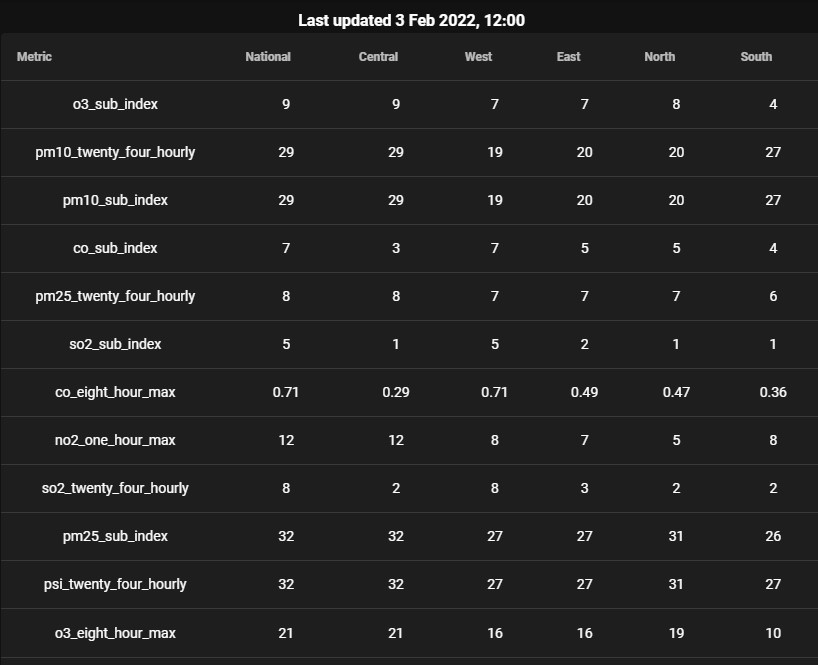
PSI table
Setup
To be completed by 9-6-2021(Thurs) 2359hrs
- This repo link will be of the format https://<username>.github.io/CSC3007-assignment1
- In the repo create a basic index.html file, and make it visible on GitHub repo pages (it's under the settings tab, under GitHub pages).
- You can put your CSS style tags, HTML and JS script code into one file, or organize them into files/directories.
The Problem
- Connect to the data.gov.sg PSI API and get the realtime dataset. It is detailed here.
- The URI for the API is: https://api.data.gov.sg/v1/environment/psi
- Print out all readings data into a table. There are 12 readings, from o3_sub_index to psi_twenty_four_hourly.
Extra Challenge
- Theme the layout of the table nicely using CSS. Or just use some nice looking CSS framework.
- Print out the timestamp of when the data in the reading was updated. Use some datetime library to output the date / time nicely.
Sample Screenshot
More details
- This portion is not a design challenge.
- It is to show you can connect to an API, pull out and understand/read the JSON data. You will need these skills in later assignments
- Be sure you know what you are manipulating in the JSON schema. Console.log to inspect the JSON structure.
- This is very similar to a previous assignment done 2 years ago in your CSC2005 course. Refer to that. There will be no starter code.
Grading key
- Some submission: 2 marks
- Basic table: 3 marks
- Theming / formatting: 4 marks
Questions?
Chi-Loong | V/R